Apple is a company that everyone is familiar with in the world of investing and in everyday life. Not many companies have performed as well in the public markets as Apple, having gone up 56.23% year-to-date upon writing this post. Despite its stellar performance, the impact of the coronavirus has had an adverse effect on the company. At the start of the new year, Apple had “slashed its quarterly revenue forecast for the first time in more than 15 years” citing a slowdown in Chinese sales, “which represents nearly 20% of Apple’s sales” (WSJ.com). The situation for Apple became worse after the coronavirus exacerbated investors’ fear in the markets while also taking a hit on the company’s production and sales.
I built a full 3-statement discounted cash flow model to dissect the financial situation that Apple faces in the current macroeconomic climate and to analyze where the company’s value currently lies in the midst of an uncertain situation. The complete model I built includes a 5-year forecasted financial statement model with accompanying schedules, and the discounted cash flow model. I’ve included a download for the excel sheet to see the full extent of the model as well as to use as a guide for anyone new to financial modeling.
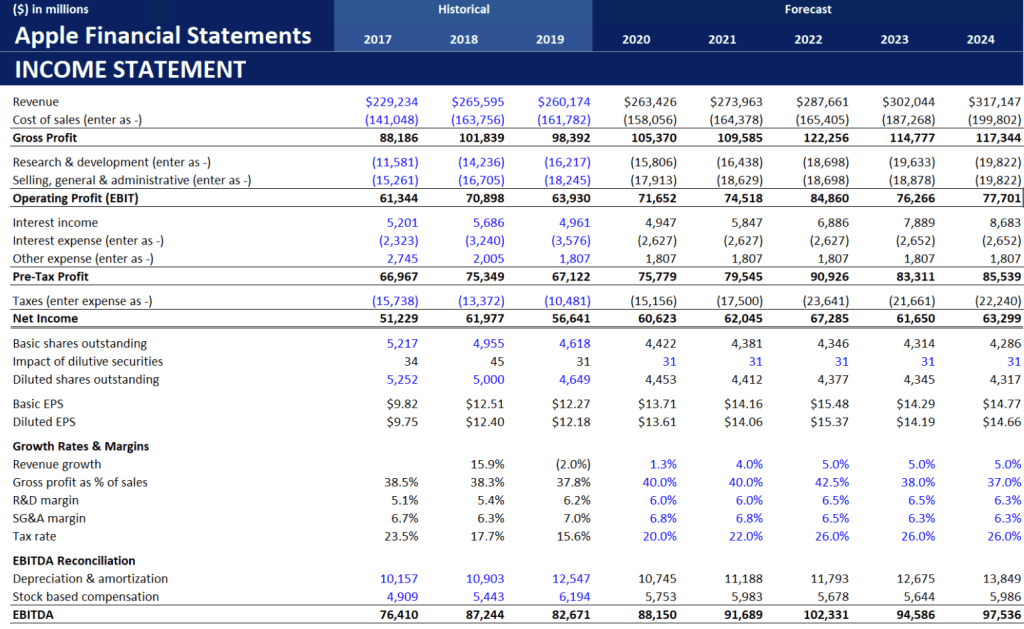

To get an idea of how the coronavirus along with slowing demand for the iPhone might impact Apple’s earnings, I used a revenue growth assumption for the first year of 1.3% and 5% thereafter assuming production and sales resumes as per usual after the coronavirus threat subsides. This model is dynamic however, and includes the functionality to test different scenarios. In this model I built out a best, base, and weak case for the forecasted growth rates and margins, which can be toggled through on the top of the financial statements page of the excel file.

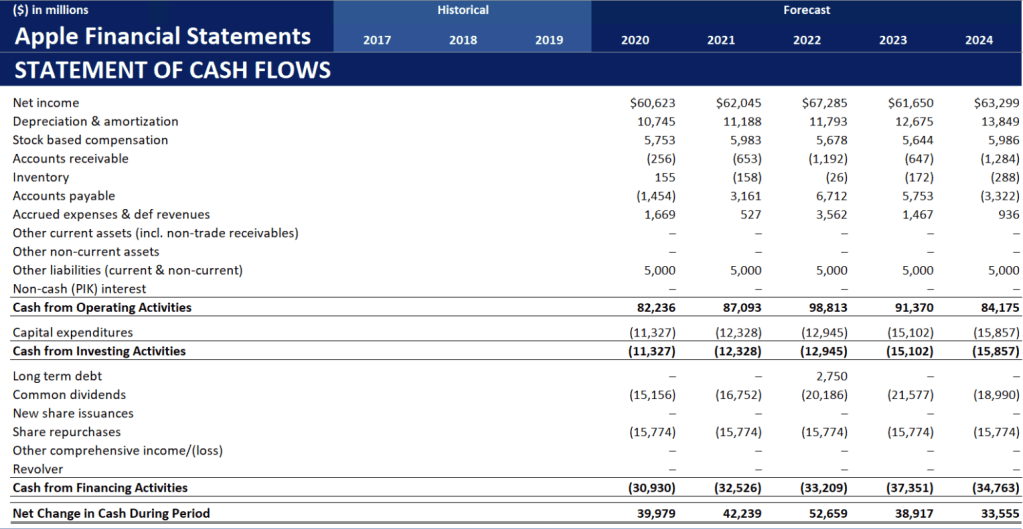
Forecasting out the 3 financial statements is necessary for the free cash flow build up that drives the dcf model. Referencing the image above, make note of the EBITDA which peaks in 2022 at $102,331, but does not fall below the 3 historical year results. Although not recognized under US GAAP, EBITDA (which stands for Earnings Before Interest, Tax, and Depreciation & Amortization) is a useful metric in company valuation. It gives investors a look at a particular company’s operational performance and efficiency. By removing the costs of interest, taxes, and D&A, EBITDA allows you to compare the operational earnings for similar companies that may have different tax, debt, and capital structures. From EBITDA we can ultimately arrive at the Unlevered Free Cash Flow, which is then discounted to find the present value.
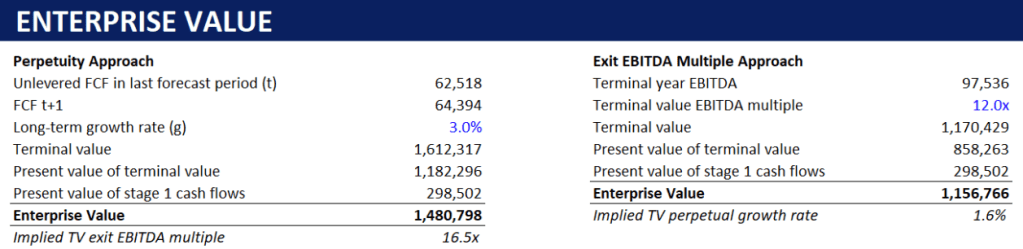
We arrive at Apple’s enterprise value, which is essentially the market cap including any cash and debt the company holds on its balance sheet. There are two approaches to calculating the enterprise value; Perpetuity approach and Exit EBITDA Multiple approach. Although both are used in this model for comparison, the Exit EBIDTA Multiple approach is the better method because the Perpetuity approach assumes that the company will grow at the same rate forever, typically resulting in the terminal value being higher than in the alternate approach. Assuming a 12x EBITDA multiple (derived and adjusted from the industry average), Apple’s enterprise value stands at $1,156,766.
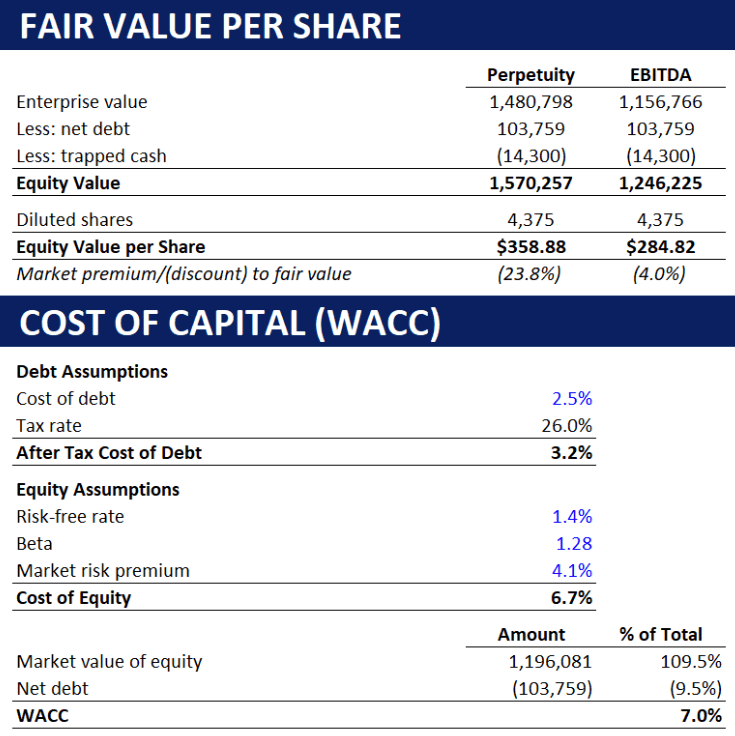
From the enterprise value we can calculate the equity value by subtracting net debt and any trapped cash. The equity value represents Apple’s value available through its shareholders. On a per share basis, we can see what the fair value market price of Apple should be. As of 02/28/2020’s close ($273.36), the equity value per share using the Perpetuity and Exit EBITDA Multiple approaches tell us that the company’s shares are trading at a 23.8% and 4% discount respectively. This means that based on my model, Apple is currently trading below its fair value. Once the extent and ramifications of the coronavirus become clearer, it can be a great opportunity to build a position in Apple. Following the equity value calculation is the WACC breakdown, which gives us a 7% cost of capital. Apple is a unique example because they hold negative debt, which is why the market value of equity accounts for 109.5% of the total capital structure.
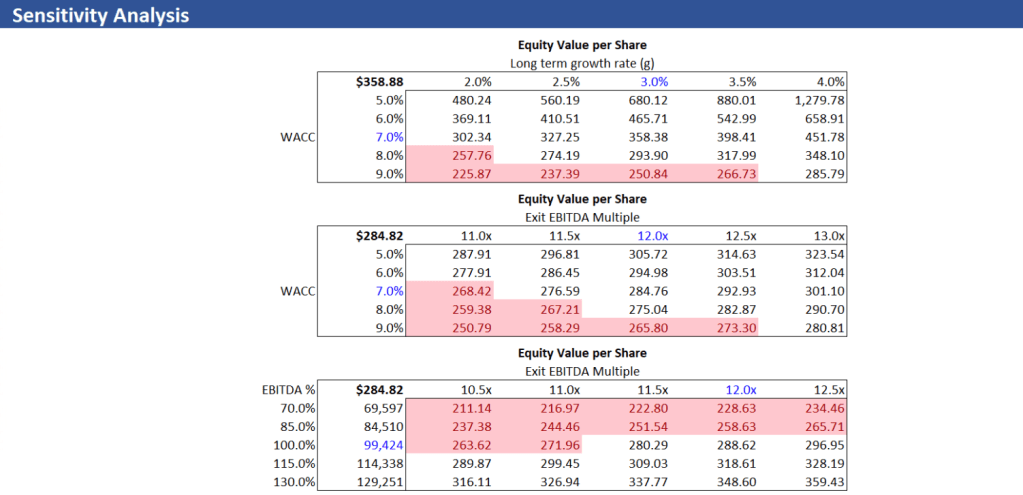
The dcf calculation is now complete following the WACC, but there are some added tables and charts that can paint a better picture of Apple’s numbers. In the image above, I built sensitivity tables to show how equity value per share in affected by changes in the long-term growth rate, EBITDA multiple, and WACC. The numbers in red highlight those conditions in which the equity value per share is below the last closing price. Sensitivity tables are especially important in investment banking because they will typically show up in the pitch books.
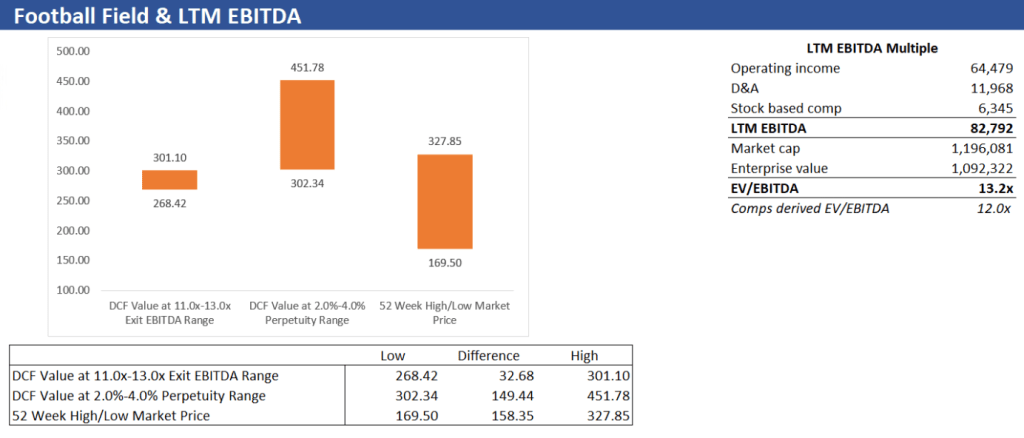
A football field graph can give you an idea of the dcf value at different growth rates/multiples compared to the 52 week high/low market price. As expected, the perpetuity approach produces a much larger range that far surpasses the 52 week numbers while the exit EBITDA is on the mid-upper end of the 52 week price. To the right is the last twelve months’ EBITDA multiple calculation. This is useful for comparing to the exit multiple used throughout the model. As we can see, the 12x multiple assumed in the model is not too far off the LTM 13.2x multiple.
Financial modeling is one of the most useful skills in any finance professional’s tool kit. Beyond the modeling itself, it is also a useful exercise in picking apart and analyzing a company’s financial statements. Valuation is about understanding a business and its drivers to determine how much a company can be worth. Going forward, I plan on building out more models and focusing on developing an investment thesis.
