Delta One Derivatives

READ ON THE NEW ASVP CAPITAL WEBSITE: https://www.asvpcapital.com/post/delta-one-derivatives

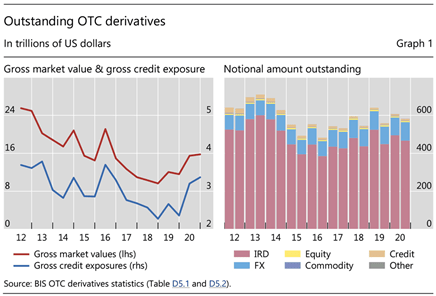
Replication is a fascinating topic in finance that combines a variety of complex instruments to create a position that mirrors a given underlying asset. This process allows investors to save on transaction costs and better manage their risk profile. With a Delta One derivative, the goal is to create a structure or product that moves in the same magnitude and direction as the underlying. Many Delta One products are heavily traded on exchanges, like ETFs, but others are designed in custom over-the-counter markets at the Delta One desk of an investment bank. These products include futures, forwards, equity/index swaps, and synthetic securities assembled using the concept of put-call parity. Trades under the Dela One umbrella are large in size and often implement leverage, so these desks make up an important piece of a bank’s risk exposure.

Introduction to Delta and other Greeks

The Greeks are terms/symbols from the options market that describe the different components and angles of inherent risk in an options position. A few of the most commonly used terms include…

Delta = measures the sensitivity of an option’s price to changes in the underlying asset price

Theta = describes an option’s time decay, which is the value lost as the contract nears its expiration date

Gamma = measures the sensitivity of an option’s delta to changes in the underlying asset price

Vega = measures the sensitivity of an option’s price to changes in the underlying asset’s implied volatility

Rho = measures the sensitivity of an option’s price to changes in the interest rate

Although these terms were originally used for options, they can be applied across derivatives products to get a fuller picture of a position’s risk profile. Breaking up the risks in this way makes hedging more targeted and allows traders/portfolio managers to deal with certain risks in isolation, like in Delta One strategies.

Examples of Delta One Products and Strategies

ETFs are some of the most widely used Delta One products on the market with investors ranging from the retail trader to larger institutions. They implement the concept of Delta One by creating a fund that mirrors the movements of a big market index, like the S&P 500. Doing this saves investors the transaction costs and time; otherwise, investors would have to replicate an index themselves by purchasing all the stocks in the index, constantly rebalancing the portfolio, and conducting research to monitor the positions. Instead, ETFs offer a low-cost channel for investors to gain broad exposure to a market index or specific sector.              

Swaps, like total return swaps or equity swaps, are another type of Delta One product that offers investors an instrument that mimics the returns of a given stock or index but without actually holding the underlying asset. Swaps are structured to give investors the profits and losses of a given asset or portfolio in exchange for periodic fee payments. In an equity swap, two parties exchange the returns of different assets, and one party receives the net amount, which is similar to the structure of an interest rate swap. The main advantage of these types of stocks is that they offer the benefits of stock/asset ownership without the operational burden of actually holding them. It also gives risky investors inexpensive access to significant leverage since the contracts don’t typically require big payments upfront. When Archegos Capital crashed earlier this year, it was discovered that the fund had taken huge, concentrated positions on only a few stocks and bolstered them by using total return swaps. According to a Wall Street Journal article, the main benefits to the fund of using total return swaps were that it “…helped enable the firm to increase its leverage, in essence owning more of an asset or assets than its cash would have otherwise allowed it to. In addition, these swaps allow investors like Mr. Hwang (Founder of Archegos) to maintain their anonymity” (WSJ). Once the positions started moving against Archegos’ expectations, counterparties quickly found out that the fund would not have the collateral to meet its obligations and that they’d have to begin liquidating their positions. Since Archegos’ positions were only in a handful of stocks, the huge sell-off moved markets and led to $5.5 billion in losses for one of their biggest counterparties, Credit Suisse.

Finally, synthetic Delta One positions can be structured by putting together portfolios using the concept of put-call parity. Put-call parity describes how a position in a risk-free instrument, European call and put, and stock can be replicated using a combination of the remaining three variables.

Put-Call Parity: c + X/(1+rfr)^t = S + p

c = call,                                                                               c = S + p – X/(1+rfr)^t

p = put,                                                                               p = c + X/(1+rfr)^t – S

S = stock,                                                                           S = c + X/(1+rfr)^t – p

X/(1+rfr)^t = risk-free instrument                    X/(1+rfr)^t = S + p – c

For example, a synthetic position in a stock can be replicated by combining long positions in a call and risk-free instrument while also selling a put. The equations above break down the different combinations and the position they replicate. Taking a synthetic position allows for some of the same benefits as the other products mentioned like offering anonymity and leverage, but they also allow for more flexibility in adjusting the individual components. The concept of put-call parity can also be extended into areas such as arbitrage and hedging strategies like fiduciary calls and protective puts.

Conclusion

Delta One derivatives are key components of modern investing, especially as products like ETFs continue to grow and become more widespread. The rise of ETFs has made the Delta One desk an exciting place to be as the finance industry continues to innovate in this area. Like most derivatives, they offer significant cost and operational benefits to investors and increase liquidity in the markets they are traded in. These instruments come with their risks however, as seen with Archegos Capital. Depending on their structure, they can be difficult to unwind, too complicated to really understand, and give easy access to excess leverage and risk-taking. Diving deep and learning to understand these instruments are what make finance so interesting.

References

https://www.wsj.com/articles/what-is-a-total-return-swap-and-how-did-archegos-capital-use-it-11617125839

https://www.forbes.com/sites/isabeltogoh/2021/11/04/credit-suisse-burned-by-archegos-and-greensill-scandals-shifts-focus-to-wealth-management-in-overhaul/?sh=6a0124872488

Interest Rate Swaps and Forward Rate Agreements

Interest rate derivatives make up some of the most complex, yet essential products in the financial system. They help lenders reshape and transform their risk while lowering financing costs and improving access to capital for borrowers. Two of the most general interest rate derivatives are interest rate swaps and forward rate agreements. These products are unique in that the underlying asset is an interest rate rather than a given security or commodity. Their use cases include balance sheet management, hedging against interest rate movements/uncertainty in the markets, and speculation. In this article, I’ll explore the differences between the two instruments, their risk and return characteristics, and outline the role they play in our financial markets.

Interest Rate Swaps

In essence, an interest rate swap is an agreement between two parties in which a series of periodic payments are exchanged over a given amount of time. These payments are netted at each settlement date with only one party making a net payment and the other receiving the difference. For instance, if on a given settlement date party A has a fixed liability of $60 and party B has a floating liability of $80, then party B will make a net payment of $20 to party A. Whichever party has the greater liability on the settlement date will be the one required to make the net payment to the other party. The value of each payment on the settlement date is derived from the rate on a notional principal amount which is never actually exchanged throughout the life of the contract. Since swaps are traded in over-the-counter markets, these contracts are bespoke and tailored to each party’s agreed upon terms.

The example in the prior paragraph describes a plain vanilla swap. This type of swap contract implies a fixed-for-floating rate exchange and is the simplest variation of a swap. Other types of swaps include basis swaps, which describes trading a floating rate for another floating rate. The universe of swaps however is vast and beyond the scope of this article, so I will focus on the plain vanilla interest rate swap.

Forward Rate Agreements

This type of interest rate derivative is based on a standard forward contract in which two parties agree to exchange an asset on a given date in the future for a price locked in at the initiation of the trade. In a forward rate agreement (FRA), the underlying asset is a future interest rate on a notional principal amount, which is never exchanged. Cash-settlement of the contract is based on the net difference between the contract’s interest rate and a reference rate. The most commonly used underlying rate in an FRA is LIBOR (which is in the process of being phased out in deference to a new rate, SOFR). Since an FRA is essentially locking in a rate for a future date, it is a valuable hedge to future borrowing/lending risk as it allows firms to have a clearer outlook on their liabilities. For example, a firm that anticipates a need to borrow money in 30 days could initiate a long FRA position. If the future 90-day rate (usually LIBOR) increases, the firm will receive a payment. If the future 90-day rate decreases, the firm will instead have to make a payment. If perfectly hedged, the firm’s cost of borrowing will not be higher, nor lower despite increases or decreases in the reference rate.

FRAs also trade over-the-counter and are highly customizable. Depending on the circumstances, a synthetic FRA can be constructed by using two LIBOR loans to replicate an FRAs payment structure.

What’s the difference?

Given the brief description of both products above, it seems as though they are very similar in nature. They both derive payments from a notional principal amount that is never exchanged, trade over-the-counter and are custom, use interest rates as the underlying, and are subject to default risk among many other shared qualities. They are also both primarily used by large institutions and professional traders.

The major difference that sets them apart is the payment structure. An interest rate swap involves a series of netted cash flows involving two parties, whereas an FRA is structured as a single net cashflow paid from one party to the other. This creates an interesting circumstance because given these two structures, an interest rate swap could be replicated using a series of FRAs.

Risks

Like many derivative transactions, interest rate swaps can become tricky to unwind when the position moves against a firm’s initial expectations. Harvard University’s plans to finance expansion in 2004 present a great example of an expensive exit from swap transactions. The university’s endowment found itself in a favorable financial position at the time; the fund had returned 16% annually over the past decade and its assets were valued at $22.6 billion. Hoping to capitalize on its strength and keep momentum moving forward, the university made plans to borrow $1.8 billion in 2008 with an additional $500 million planned through to 2020. In order to hedge the future debt issues and lock in historically low financing costs (the US Federal Reserve’s overnight rate was 2.25% at the time), Harvard entered into $2.3 billion worth of interest rate swaps. Things took a turn for the university in 2008 however when the credit crisis caused central banks to lower rates, which led to huge losses on the swaps since they’d be paying a premium over market rates. This saw the value of their endowment fund, which had grown to as high as $36 billion, fall 30% to $26 billion, triggering a liquidity crisis.

In an effort to unwind the position in interest rate swaps, the university had to issue debt to terminate $1.1 billion worth of the swaps with the remaining amount to be paid over 30+ years. This led to considerable cost-cutting initiatives around campus at a time when they were supposed to be expanding. The Harvard deal really illustrates how you can have the right idea (it made sense to lock in what they thought were low rates at the time), but still get burned by derivatives when markets don’t move as originally forecasted.

Conclusion

According to the Bank for International Settlements, the gross market value of over-the-counter derivatives increased to $15.8 trillion during the 2nd half of 2020. The total notional amount of these derivatives came in at $582 trillion, of which interest rate derivatives made up just over 80% at $467 trillion.

Interest rate derivatives are embedded into all corners of the financial system as more firms and institutions rely on these instruments to reshape risk and hedge against uncertainty. They are fascinating tools to try to understand, especially as they get more complex, with interest rate swaps and FRAs serving as a nice introduction to the topic. Financial innovation will continue to find clever ways to repackage risk and make the landscape for derivatives even more expansive than it currently stands.

References

http://janinewedel.info/Harvard-Swaps.pdf

https://www.bis.org/publ/otc_hy2105.htm

Lululemon Goes Beyond Athleisure

This article was originally published on 6/25/2021 here: https://www.kennedypinecapital.com/post/lululemon-goes-beyond-athleisure

While many companies may have benefited from 2020 trends like work from home and increased government stimulus, only a few are positioned to maintain the accelerated level of performance they were afforded during the pandemic year. Lululemon, whose offerings include some of the most high-quality products in athleisure, is set to capitalize on the market opportunity to drive expansion beyond their current business model. The company and its stock price have seen considerable growth over the past five years, with shares appreciating almost 400% in that time, as revenues climbed at a 16.4% compound annual growth rate (CAGR). More exciting, however, is what’s ahead for Lululemon with cutting edge technology and new product launches leading the way.

Pandemic-related store closures hit Lululemon as hard as many other retailers that were forced to lockup through the uncertainty in 2020. Despite a shaky start to the fiscal year, Lululemon’s sales were lifted thanks to the strength of its ecommerce channel, which grew 93% y-o-y in 4Q2020. This growth was well ahead of the guidance management laid out in their ‘Power of 3’ growth strategy, allowing the company to “…achieve, three years early, our 2023 goal of doubling our ecommerce revenue from 2018 levels,” according to CEO Calvin McDonald. This speaks to the strength of Lululemon’s brand as athleisure over traditional sportswear since customers were still buying their products despite having to stay home while gyms were closed. Anita Balchandani, a partner at McKinsey & Co’s London office, described on The McKinsey Podcast that “People have realized that clothing that’s comfortable, that feels well, that feels good, that is well made has become much more important… so that probably is something that will continue”1. To Lululemon’s credit, its ecommerce channels were able to handle the unanticipated demand boost to continue delivering sales while also driving user engagement on its online platforms. The company can successfully capture the momentum from its 2020 gains through the unveiling of its customer loyalty program, which should be a hit given how strongly customers feel about the brand.

Along with more than doubling digital revenues by 2023, the company’s ‘Power of 3’ growth strategy also includes doubling men’s revenue by 2023 and quadrupling international revenues by 2023. As of their latest 10-K (03/30/2021), men’s product sales are up 38% since 2018. One factor we anticipate will drive growth in the men’s segment is the future launch of Lululemon’s footwear. Expanding into footwear marks a big step for the company that will serve to broaden its customer base while also opening the door to venture into product lines associated with different sports (and potentially even athletes, similar to what Uniqlo has done in its partnership with Roger Federer). Footwear will also make the company a top-to-bottom clothing brand, which we expect will promote brand loyalty as customers can now put together entire outfits consisting of only Lululemon gear.

International expansion, which makes up the third spoke in the ‘Power of 3’ growth plan, has a lot of runway to grow. Since 2018, revenues outside of North America grew 73% to make up almost 15% of Lululemon’s total revenue. CEO Calvin McDonald is bullish on the opportunity to grow internationally, stating that the revenue split can be as high as “…50/50 in the years to come” 2. Adding stores in markets like Japan, South Korea, China, and Australia, will make reaching $1.44B in annual sales outside of North America not too far out. These regions are home to growing economies driven by a rising middle class that is looking to indulge in quality items like those offered by Lululemon.

MIRROR Acquisition

Subscription revenues are a valuable source of high margin recurring income and have thus become a popular business model everywhere from movie and tv streaming to online exercise and training platforms. Lululemon’s 2020 acquisition of MIRROR for $500M in cash allows the company to enter the fast-growing connected fitness equipment industry and earn subscription revenues. MIRROR’s flagship product provides users with live and on-demand exercise sessions with top trainers that they can access from the comfort of their own home. When not in use, MIRROR also doubles as a fully functional mirror. With lockdown orders keeping people away from the gym for most of 2020, demand for at home fitness equipment skyrocketed. This growth was marked by the performance of companies like Peloton, which has grown into a company generating $4B in revenue with a market cap of around $30B. Given these trends, we expect MIRROR will have a lot of runway to grow, especially as it assimilates into Lululemon’s core business. The investment has already exceeded management’s expectations, generating $170B in revenue for 2020, and offers Lululemon plenty of options to further integrate the technology into its business.

This strong start to the MIRROR investment has prompted management to invest heavily in accelerating company growth. Management laid out plans for the interactive mirror in their Q4 earnings call, which includes adding two more production studios to increase live classes, recruiting more instructors, and developing in-store experiences designed around MIRROR. Store reopening’s present an opportunity to introduce the technology to more customers and try it themselves. Furthermore, it can be used to facilitate the shopping experience if it features services like virtual fitting rooms to help customers make purchase decisions. Management recognizes this potential and is expecting MIRROR sales to increase up to 65% for a $275M contribution

Valuation

Using analyst consensus estimates for revenues and EPS, I forecasted Lululemon’s financial statements 5 years out to begin my valuation. Wall Street expects the company’s sales and earnings to grow at a CAGR of 17% and 23%, respectively. Considering the value MIRROR will unlock, even these growth rates could be understating Lululemon’s performance potential.

One of the biggest strengths on Lululemon’s balance sheet is the fact that it holds a negative net debt balance. It is able to hold such a low debt balance relative to cash because the company funds its operations primarily through operating leases. Assets financed by way of operating leases include “certain store and other retail locations, distribution centers, offices, and equipment” according to the company’s latest 10-K (03/30/2021). Using leases offers the company better rates on financing and less restrictive borrowing terms, while also alleviating the pressure of maintaining and replacing out-of-date equipment since the leased asset will be returned. This allows Lululemon enough flexibility to execute on its expansion and product development strategies and maintain an accelerated level of growth.

Some key assumptions I used in my discounted cash flow model were a WACC of 5.7% (consisting primarily of the cost of equity), a perpetual growth rate of 3.5%, and an exit EBITDA multiple of 32x. Enterprise values using the perpetuity and exit EBITDA multiple approach came in at roughly $66B and $77B, respectively. Arriving at the equity value per share, the model concluded that Lululemon’s shares trade at an average discount of around 40% from its intrinsic value. This implies a long-term price target of $500+ as the market begins to realize the company’s value coming out of the pandemic.

Further breaking down the company’s stock price potential using the DuPont 5-part ROE formula further shows the advantages of keeping a low debt balance with Lululemon’s interest burden consistently hovering at 1.0. The company’s DuPont ROE totals 26%, which is more than double that of most peers except Nike, whose DuPont ROE is 31.52%. Nike’s advantage in ROE comes from a higher leverage ratio of 3.89 that the company is able to maintain at an interest burden of 0.95. Getting more aggressive on leverage could serve to grow ROE and elevate earnings while granting Lululemon the funds to finance its ambitious expansion plans

Finally, the company’s P/E ratio (TTM) of 73.28 is higher than Adidas and Nike (55.41 and 63.99 respectively), but lower than Under Armour’s P/E of 85.89. Relative to Nike and Adidas, who have a stronger focus on footwear and are more mature in their life cycles, Lululemon has more growth opportunities at hand as it accelerates its international expansion plans, stretches into new product lines, and continues to innovate in its workout equipment and apparel technology. Under Armour, on the other hand, seems to trade at an expensive P/E relative to peers despite struggling to achieve profitability, indicating it’s stock may be overvalued. Lululemon has the highest P/S out of its peer group, at 9.76, which is expected considering the headroom it has through MIRROR’s subscription revenues to drive sales.

Risks

Lululemon’s products sell for a steep premium, exposing the company to the threat of lower cost competitors. Some brands have recently gone as far as indirectly referencing Lululemon’s high price tags in ads to sell low-cost substitute products. Additionally, recent concerns around inflation could impact the demand for a product that is already priced so high.

As people resume their daily commutes back to the office, the momentum from remote work that has been driving athleisure’s recent popularity may begin to slow. This would likely suppress sales volumes since a large portion of non-athletic-use customers would reduce their spending on Lululemon’s products.

Conclusion

Over the years, Lululemon has established itself as more than just an athletic apparel company. It instead created a sense of community among its loyal customer base who are drawn to the premium quality products and engaging in-store/online experiences. Lululemon is all about promoting an ‘active lifestyle’, which is what allows the brand’s reach to extend far beyond the gym or competition sports.

The company is in an encouraging position coming out of the pandemic. Store reopening and expansion will give Lululemon a platform to re-engage customers and show off future growth drivers like MIRROR and eventually footwear. Ecommerce will also continue to be a key sales channel as online shopping habits developed in the midst of the pandemic persist. Below I’ve put together a SWOT analysis outlining Lululemon’s competitive profile:

Shares currently trade around 15% off from 6-month highs, with any downward price movement reflecting a great opportunity to build a position in the company. Lululemon is set to report earnings next week on June 3rd, with analyst consensus forecasts anticipating 2Q2021 EPS of $0.90. The call will likely provide more color on topics like MIRROR’s integration and performance, store reopening’s/expansion, footwear, progress on the ‘Power of 3’ growth plan, and the rollout of their customer loyalty program. We are long-term bullish on Lululemon.

References

(1) https://www.mckinsey.com/industries/retail/our-insights/the-postpandemic-state-of-fashion#

(2) https://financialpost.com/financial-times/lululemon-plans-overseas-expansion-as-yogawear-booms

How Beyond Meat Sets Itself Apart

This article was originally published on 5/3/2021 here: https://www.kennedypinecapital.com/post/how-beyond-meat-sets-itself-apart

Plant-based proteins have come a long way in terms of quality, texture, and flavor, to establish themselves as legitimate alternatives to traditional meat protein. Beyond Meat is uniquely positioned to push the alternative meat industry forward and benefit from its subsequent growth through advantages in brand recognition, research and operations, and scale relative to other plant-based businesses. Capturing the immense growth opportunity facing Beyond Meat won’t be easy; they face competition from not only other plant-based companies like Impossible Foods, but also meat industry players like Tyson.

Two names stand out above the rest when it comes to realistic alternative meat offerings: Beyond Meat and Impossible Foods. Both companies share the similar goal of creating products that have positive impacts on health and the environment. Although they both make alternative meat products, the ingredients and processes they use to develop their plant-based offerings are very different. Impossible Foods’ key ingredient, as well as its most controversial, is heme. Heme, which is what makes Impossible Foods’ burger patties bleed like a real beef patty, comes from genetically modified yeast in combination with DNA extract from soy plants. While many credit the protein with giving Impossible Foods’ burger it’s signature ‘umami’ flavor, it has also faced backlash due to its use of Genetically Modified Organisms (GMOs), reliance on soy (4), and testing concerns. This could prove to be unpopular as consumers have become more health conscious as a result of the COVID-19 pandemic, giving Beyond Meat the advantage in that their products are non-GMO and based on pea and mung bean.

Beyond Meat also has an advantage over Impossible Foods when it comes to retail penetration and partnerships. Some of the strongest names in retail and foodservice carry Beyond Meat’s products, including Walmart, Target, Whole Foods, McDonald’s, Starbucks, and Yum! Brands among others. In their most recent investor presentation, the company paraded that 28,000 US retail distributors, 42,000 US foodservice outlets, and 52,000 international retail and foodservice providers carry Beyond Meat products. On the other hand, Impossible Foods has solid partnerships with brands like Burger King, Qdoba, and Kroger’s, but their products are sold mostly in major cities since their expansion plans have not been executed or funded as comprehensively as Beyond Meat’s.

The biggest names in the $1.4T global meat industry have had to accelerate the production and rollout of their own alternative meat offerings since these plant-based disruptors have effectively shifted the industry landscape. Traditional companies in the meat industry, like Tyson, see “…this move as more of a growth opportunity than a pivot away from its traditional meat offerings.” (1). They have the operational scale and distribution channels to compete with Beyond Meat but lack the focus and progress on research and production that Beyond Meat enjoys. This is supplemented by the success and quality of Beyond Meat’s latest iteration of their burger patty, the Beyond Burger 3.0, and their expansion into Europe and Asia through new production facilities in the Netherlands and China.

Fortunately for Beyond Meat, they have the financials to take full advantage of the market opportunity in front of them. The company is projected to generate $583M and $892M in revenues for the next two years, reflective of the high growth expectations for the alternative meat industry. The company ended their most recent quarter with a $159M cash balance, allowing Beyond Meat to continue their capital expenditure strategy by investing in new production facilities to enhance their operational scale and break into new regional markets. While interest rates remain low, the company should take advantage of low borrowing costs to finance their growth strategy. Debt financing is especially important given the persistent dialogue surrounding inflation recently. This is because when inflation rises, borrowers gain an advantage to lenders since future obligations would be paid with a less valuable currency in real terms.

Beyond Meat will likely focus on investments in Asia, who CFO Mark Nelson has previously said “…has a desperate need for this [Beyond Meat’s products]” (2). Their investments in China coincide with the country’s rising middle class, within which beef is becoming a staple. Another interesting region the company is exploring possible opportunities is in India. Not only is India the second most populous nation (China being first), but it is also recognized as one of the largest vegetarian populations in the world. This represents a huge opportunity for Beyond Meat, who is capitalizing on it by launching their Beyond Burgers and Beyond Sausages in the country on April 13 (3). This aggressive expansion strategy will pay off as the Beyond brand establishes itself as the biggest and most widely recognized name in the global alternative meat industry.

The long-term bull case for Beyond Meat is clear. The company is taking all the right steps to maintain and grow the lead they have built within what was once considered a ‘niche’ market in alternative meats. We can expect to see short term price fluctuations in the company’s stock as they continue to make necessary investments in growth. In the long term however, the company’s increasing scale will allow it to benefit from wider profit margins, potentially leading to rapid capital appreciation in BYND stock.

References

(1) https://thecounter.org/after-backing-out-of-beyond-meat-tyson-foods-announces-a-new-plant-based-brand-of-its-own/

(2) https://www.cnbc.com/2019/06/07/beyond-meat-one-overseas-market-has-desperate-need-for-plant-burger.html

(3) https://www.veganfirst.com/article/breaking-beyond-meat-launches-in-india-available-at-multiple-stores

(4) https://www.health.harvard.edu/staying-healthy/confused-about-eating-soy

Corsair’s Second-Half Outlook

Well over a year after the start of pandemic lockdowns, companies are still assessing the risks and bottom-line implications of COVID-19. Caught in the middle of it all is Corsair, whose gamer and content creator-oriented products faced increased demand amidst stay-at-home orders and industry-wide supply shortages.

The company’s products are split among two categories:

  • Gamer and creator peripherals, which include keyboards, headsets, mice, and more.
  • Gaming components and systems, which include RAM sticks, PC cooling systems, case fans, and more.

These products target both the casual, first-time gamer as well as the enthusiast who demands high-quality professional grade gear to enhance their gaming experience.

Accelerated growth in gaming, esports, and streaming

The sudden need to adapt and improvise throughout the pandemic has sparked a priority shift in people’s habits and needs, which has helped propel many industries forward. Gaming in particular has become more widely adopted as people find solace in the comfort of their own homes. The role of video games in society has changed dramatically over the years. No longer is it considered a mindless drain of time exclusive to kids and young adults, but rather an escape into an online community where people from across the globe can immerse themselves into other worlds and share experiences.

Furthermore, this widespread acceptance has allowed professional gamers and content creators alike to gain bigger platforms as eSports continue to evolve and sites like YouTube and Twitch become people’s primary means for entertainment. The legitimization of eSports is a key growth catalyst since it can create a whole new world of technology and service innovations intended to improve performance for players in big tournaments. Corsair is best positioned to capture this rapidly growing market through its comprehensive product offerings that make up a complete gaming/streaming ecosystem. Its competitive advantage lies in the fact that the company is there for the entire PC gaming journey; from the initial PC build to upgrading and maintaining the whole setup. CEO Andy Paul, who co-founded the company in 1994, commented on the company’s latest earnings call that his “belief is that the situation in 2020 and early 2021, where gamers spent more time home, learning to play better, that should establish a higher base of consumers ready to step up and upgrade their gaming setup” (1).

The Elgato brand, acquired back in 2018, unlocked heaves of potential and secured a company that has become synonymous with streaming. The big advantage the Elgato brand provides the company is in higher margin products. Some of the most notable products Elgato offers streamers are $200 ring lights, $160 microphones, the $150 stream deck, and the recent release of their first webcam, which currently sells for $200. The biggest streamers on platforms like Twitch broadcast themselves from setups featuring a mix of all these products. The association with streamers will help influence customers who want to build setups similar to that of their favorite creators. The more Corsair is able to expand its product offerings to cover more facets of gaming/streaming on PCs, the more its total addressable market will continue to grow.

Global Supply Chain Shortages

Modern society has transitioned into an age where almost everything you buy comes equipped with a CPU to power the latest features in technology. A perfect storm of technological innovation coupled with overwhelming demand gave way to the semiconductor shortage that slowed production in everything from cars to smart home appliances. For gamers, this meant that their PC build plans, or upgrades, would have to be put on hold while they waited for key components like AMD’s CPUs, NVIDIA’s graphics cards, and even Corsair’s power supplies to come back in stock.

Corsair’s management team is proving its resilience through the situation as they reported growth in every product category on their latest Q2 earnings call. CEO Andy Paul, who co-founded the company in 1994, commented that because of the shortages, “we believe there is a large number of gaming enthusiasts in the wings waiting to build a new PC on top of the elevated numbers of people that actually did build a new gaming rig” (1). This is encouraging considering the company delivered its second-best quarter ever for net revenue and gross profit growth despite not having as much supply as it would have liked. The pent-up demand should continue to drive Corsair’s momentum beyond the pandemic tailwinds that boosted sales growth from about 24% in the pre-COVID US, to approximately 80% once lockdowns were instated.

Long-term debt management

Corsair’s Q2 earnings call highlighted plenty of strengths despite the headline earnings miss. Most notably, the company is directing $25M in Q2 operating cash flows towards paying down debt. This brings its year-to-date debt paydown total to $53M with an additional $47M expected to be paid off in the second half of the year.

Earlier in the year, S&P upgraded the company’s corporate credit rating from B+ to BB-. More good news fell upon the company in June when Moody’s also decided to issue an upgrade of its own, increasing Corsair’s corporate credit rating from B1 to ba3. In the accompanying research, Moody’s stated that the upgrade “reflects the strong demand for the company’s gaming and streaming peripherals and gaming hardware products, leading to strong operating performance and reduced leverage” (2). It also mentioned that “Corsair’s low leverage and solid free cash flow coupled with good product development capabilities provide flexibility to maintain the strong reinvestment and marketing necessary to sustain and improve the company’s market share” (2). The company’s stock price reacted well to the upgrade, as investors pushed the price up as much as 20% in the month of June following the announcement. Strong credit management will give the company the flexibility it needs to continue scaling up and capturing market share through lowered interest expense and easier access to capital.

Financials and valuation

I modeled Corsair’s financials based on analyst consensus estimates for revenue and EPS growth through to 2025. On Corsair’s Q1 earnings call, management raised guidance given the strong start to the year and positive demand trends. Under management’s new forecast, revenues would come in between $1.9B and $2.1B, up from the original figure of $1.8B to $1.95B. Adjusted operating income is projected in the range of $245M to $265M, which will be key to executing on the $100M debt reduction plans for the full year.

To arrive at Corsair’s intrinsic value, I built out a discounted cash flow model and valued the company using a peer group average EV-to-EBITDA of 10.9x (The sample group included Corsair, Logitech, Razer, ASUS, Dell, and HP). For the WACC, I calculated 5.3% based on a 5.4% cost of equity and 3.2% cost of debt with equity making up the majority of the capital structure.

At an equity value of $4,275,720 (in thousands), I calculated a fair value per share of $47.21. This implies that shares are trading at a 41.5% market discount given Friday’s closing price of $27.64. Shares have been trading at under $30 for the month of August so far, a roughly 30% fall from three-month highs. Some of the selling activity pushing the price down could be attributed to EagleTree Capital, who took a roughly 92% stake in the company before it was publicly traded, cashing in on a portion of the investment. According to Corsair’s recent Schedule 13 G/A SEC filing, EagleTree Capital’s position now stands at around 60%. Shares could start trending towards the $47.21 price target over the next months as the institutional selling pressure subsides.

                Several fundamental measures also suggest that Corsair shares are cheap right now relative to its main competitor, Logitech. Corsair trades at a FWD price-to-earnings ratio of 19.70 while Logitech’s FWD price-to-earnings ratio sits at 27.16. Price-to-sales and EV-to-EBITDA also imply a discount with Corsair trading at multiples 27% and 69% lower, respectively, compared to that of Logitech. These levels represent a favorable price to open or add to a position in Corsair and capture growth as the company execute its strategy to gain more market share.

Risks

There are several risks to take into account when considering an investment in Corsair stock. Cloud computing is a risk that stands out among those mentioned in the MD&A from Corsair’s latest 10-K. The cloud computing industry is increasing at a rapid pace, providing software solutions at both the individual and enterprise level. If cloud computing capabilities keep advancing to the point where high-performance computers could be accessed over the internet on dummy terminals, it could have a big effect on demand for Corsair’s PC component hardware. It is thus imperative that the company maintains its pace of product launches and investments in R&D to keep up with the technological capabilities cloud computing could unlock.

That leads to the second risk, which is Corsair struggling/failing to keep up with new product releases. Technological innovation moves fast, especially when it comes to PCs and gaming, so it is necessary that the company delivers differentiated products to gain an edge over competitors. The company has made its commitment to releasing products on a regular basis clear, having launched over 75 new products in 2021 so far. A slowdown in its product pipeline could result in the company falling behind its competitors and losing its reputation as a leader in high-quality, professional grade PC components and peripherals.

The third risk to highlight is Corsair’s reliance on Amazon sales channels. In the MD&A from Corsair’s latest 10-K, management stated that “in 2020, 2019, and 2018, Amazon accounted for more than 10% of our net revenue, at 24.6%, 25.1% and 22.4%, respectively” (3). One issue that this presents is the lack of accounts receivable insurance for orders made over Amazon; this could create uncertain revenue forecasts as potential customer defaults are left unprotected. The other issue is that any change in policy over at Amazon, or a decision to reduce/stop selling Corsair’s products on the site, will have a significant impact on the company’s financial position. The company has already made strides in developing its direct-to-consumers sales channel through its acquisition of SCUF and Origin, which has helped lift the direct-to-consumer sales channel as a percentage of revenue.

The final risk is to note is the potential timeline in regard to the global semiconductor shortages. If the situation becomes drawn out longer than expected, Corsair will be missing out on sales by not being able to meet supply with demand. This could also stunt innovation in the industry as companies wait for operations to resume at normal levels.

Conclusion

The SWOT analysis below summarizes Corsair’s competitive profile.

While Corsair may face competition and headwinds coming from many different angles, the company’s robust product offerings are a competitive advantage that will serve to increase its total addressable market as eSports and streaming continue to grow. Amidst the selling pressure and Q2 earnings miss that have pushed the stock price down, now is a favorable time to increase or open a position in Corsair as it works toward a long-term price target of $47.21. I expect the price will continue to fluctuate in the short-term as the newly public company tries to find its footing in the stock market.

DISCLOSURE: I own a position in Corsair under 100 shares.

References

Grubhub Turns Down Uber, Closes Deal w/Just Eat Takeaway


With potential suitors coming in from the US, Netherlands, and Germany, Grubhub has finally agreed on a deal to merge with Just Eat Takeaway. This comes after deal talks with Uber collapsed over antitrust issues and clauses. Grubhub opted for the higher $7.3 billion all-stock bid from the Dutch food delivery service over Uber’s proposed $6 billion bid.

The deal with Just Eat Takeaway makes more sense from Grubhub’s perspective. As one of the only delivery apps running a profitable business model, Grubhub is well positioned to remain a competitive force in the space as it competes against market leader, DoorDash. They also gain a more global reach by merging with Just Eat Takeaway, which operates in many European countries including Portugal, France, the Netherlands, Germany, and Switzerland among others.

For Uber, missing out on this deal will be very disappointing. Acquiring Grubhub would have vaulted the combined company over DoorDash in terms of market share, while also steering the company towards profitability through the potential $1.9 billion in synergies. The antitrust risk was too much to handle for Grubhub, who pushed for a breakup fee in the contract in case the deal with Uber ran into regulatory roadblocks.

Grubhub CEO, Matt Maloney, went on CNBC this morning to discuss the deal and what led up to agreeing to a deal with Just Eat Takeaway over Uber. The interview is linked at the bottom of the article. What are your thoughts the mobile delivery space, and what this means for Uber going forward? Feel free to comment below or send me a message. Thanks for reading!

Matt Maloney interview: https://www.youtube.com/watch?v=8dXExjG7ZDQ

Original write-up on the potential Uber-Grubhub deal: https://asvpcapital.finance.blog/2020/06/10/potential-acquisitions-of-grubhub/


Potential Acquisitions of Grubhub

In an attempt to navigate towards a more profitable business model, Uber is working on a potential acquisition of the mobile food delivery app, Grubhub. A move like this would cement Uber CEO Dana Khosrowshahi’s reputation as an acquisition oriented business leader. This move comes as companies such as Uber and Lyft, who are notoriously focused on revenue growth over short term profits, look towards consolidation as a means of developing synergies to cut costs and increase profit margins.

Acquiring Grubhub would be a major step for Uber in achieving the scale necessary to render their services profitable, but there are a few hurdles standing in the way of closing the deal. The challenges that Uber faces are the regulatory backlash that would result from a deal between two companies with such large market share, and other potential suitors looking to consolidate through an acquisition of Grubhub. First off, we must address the antitrust risk. In recent years, Congress has become more strict when vetting mergers to avoid the creation of any monopolies or market manipulating forces. It is a topic most prevalent in the tech industry today, especially with big firms such as Google and Amazon drawing attention in antitrust charges over their dominant position in their respective fields. The same scrutiny would apply to an Uber-Grubhub deal, as it would remove a competitor from a space in which only a handful of companies are reliable market leaders. It is an expensive risk which was taken into account through Grubhub’s request for a breakup fee triggered in the event that the deal is blocked. In the case of an Uber-Grubhub deal, I see consolidation as being absolutely necessary for the long-term survival and sustainability of the firms because it would get the company towards profitability much sooner.

Unfortunately for Uber, they are not the only company trying to put together a deal for Grubhub. Two European companies, Just Eat Takeaway (Netherlands) and Delivery Hero (Germany), are also in talks with Grubhub. Just Eat Takeaway is said to be in advanced talks and may snag the deal away from Uber. From Uber’s perspective, it is important to weigh the risks included in closing a deal for Grubhub. They could be missing out on an opportunity to increase scale and develop extremely valuable synergies, but the added pressure from other suitors might make them rush into an unfavorable antitrust-ridden deal.

Potential Deal Structure

The deal structure is key to Uber executing on the proposed acquisition. Just Eat Takeaway’s latest offer is structured as an all stock deal, so I implemented similar assumptions into my excel model. Grubhub is said to be seeking an exchange ratio of 2.15 Uber shares/Grubhub shares, but latest talks state an exchange ratio of 1.925. Luckily for Uber, they have a lot of room to work with when it comes to pricing the deal as we’ll see later in the sensitivity table. The assumptions in the screenshot to the left value the deal at over $6 billion. All stock deals are especially favorable today because of how high market valuations are reaching, creating an environment for more expensive stock prices. With a business model working towards achieving profitability, it is important that no percentage of cash is misallocated.

Accretion/Dilution Analysis with Sensitivity Table

As a strategic acquisition, a deal for Uber must be accretive in order for it to be worth pursuing. With potential synergies coming in at $1.9 billion, a potential deal could be accretive for Uber by $2.13 per share. It is a move that will work in the long run as Uber continues to shape their business towards a more mature model. The accretion/dilution sensitivity table above shows how crucial an all stock deal is, allowing Uber to be flexible when it comes to the offer price.

Consolidation tends to be the most persistent theme in industries where growth companies are taking over despite not having a clear path to profitability. These companies need to achieve scale, and fast, in order to avoid burning through all their resources before realizing their full potential. Whether Uber-Grubhub talks fall through and Just Eat Takeaway picks up the deal is yet to be seen, so I will be actively following the headlines and further report if anything is finalized. Thank you for reading, and as always the excel model I built is included to download at the end of this post. What are your thoughts on revenue focused startups that disrupt industries before even establishing profitability?

Update (06/11/2020): https://asvpcapital.finance.blog/2020/06/11/grubhub-turns-down-uber-closes-deal-w-just-eat-takeaway/


LBO of News Corporation Based on HBO’s “Succession”


After watching HBO’s Succession, I thought it would be interesting to draw comparisons between the real and fictional implications of the company that is at the center of the show. Based on real life media magnates like the Redstones and the Murdochs, the show portrays what it is like at the top of a global media entertainment and publishing behemoth. The fictional firm, “Waystar Royco,” is comparable to Rupert Murdoch’s News Corporation who at one point owned notable names such as 21st Century Fox, Fox Corporation, Dow Jones & Company, and News UK. In 2013, Rupert Murdoch decided to split the entertainment and publishing assets into separate entities. Throughout this post, I will take a closer look at the business described in Succession and also build an LBO model on News Corporation, basing my information from scenes in the show. Disclaimer: there may be some spoilers in the next two paragraphs.

Some of the most interesting plots in Succession follow the corporate drama and decision making amidst a power struggle for the top job at Waystar. In the first season, we see Kendall Roy (son of Logan Roy, CEO and Chairman of Waystar Royco) briefly takeover the CEO role while his father recovers from health issues. Upon assuming the role, he finds out that his father had taken out a $3 billion loan through a shell company that was now in violation of its debt covenant, which was tied to the company’s stock price. Following the news of Logan’s health issues, the stock dropped below $130, triggering the debt covenant and forcing Kendall to take action by receiving private equity capital and restructuring.

Logan, not ready to let go of his executive role, takes the throne back from Kendall after an unsuccessful attempt to permanently vote Logan off the board… much to Kendall’s dismay. In an attempt to regain control of the company, Kendall teams up with a close friend’s private equity firm to launch a $140 offer to take Waystar private. He has built up the board’s support, making the closing of the deal appear as if it is only a matter of time. This is the part of the show that inspired me to build an LBO model on News Corporation and see what the fictional deal would look like on its real life counterpart.

Assuming that at one point Waystar stock was trading around $130 and that Kendall would eventually launch a $140 offer, I used a 7.7% premium for the News Corporation offer (130/140 – 1). My model uses News Corporation’s 10-K from June 30, 2012 and September 30, 2012 because it was at this point that the company most resembled Waystar as Rupert Murdoch would shortly thereafter complete the split of entertainment and publishing, decreasing the overall size of the company.

As of their first quarter 10-Q from 2012, News Corporation’s stock traded at an average of $24.45. On a 7.7% premium, the price rises to $26.33, valuing the deal at $61.7 billion with 2.345 billion diluted shares outstanding at the time.

Offer value per share and deal/financing structure

A deal the size of this requires an extraordinary amount of debt financing. Thankfully, News Corporation’s business generates large steady cash flows that would ease the load considering all the debt they would take on. In an LBO, the financial sponsor will typically sell off some of the businesses’ existing assets to help finance the deal. Considering that 21st Century Fox would eventually be acquired by Disney in 2019, we can assume that those assets are up for sale once the LBO is completed.

The image above displays the sources/uses of funds along with the financing fees. Since it is a majority family owned company, I factored in a management rollover of $11.75 billion so that the Murdochs retain a significant stake in the newly private company. This amounts to a 37.5% of ownership, while the financial sponsor picks up 62.5% ownership of the company. The funds raised in the Sources tab will be used to pay the offer value, deal fees, and refinancing of the old company’s debt. The deal fees are the transaction and financing fees to the right of the Sources/Uses tabs. Further down in the model is a debt schedule that goes through the payment details of the junior and senior tranches, showing how long the private company will hold a balance for.

Exit Valuation at different EBITDA multiples

Private equity makes investments in companies that they expect to hold for around 3 to 5 years before making a return. The image above goes over the exit valuation of the investment in News Corporation at different EBITDA multiples. In the middle at 7x EBITDA, the company’s enterprise value falls to $47 billion from $61 billion at the start of the investment (not taking into account any sale of 21st Century Fox or other assets). The original enterprise value was driven by a higher LTM EBITDA than what was considered average for the company. The Income statement forecast calculated EBITDA at $6.3 billion in 2013 growing year over year to $6.8 billion in 2017. These numbers are more in line with the historical EBITDA, suggesting that the initial LTM EBITDA could be an outlier. Further down in the exit valuation is the management and sponsor equity, which has resulted in an IRR of 10.2% for both from the original $11.75 billion and $19.6 billion initially invested by both parties respectively.

Summary of returns and sensitivity analysis

The Summary tab above consolidates the most relevant information based on the 7x EBITDA multiple at exit. The financing structure shows that over 50% of the deal was debt financed while 28.9% came from the financial sponsor and 17.3% came from previous equity rollover. Leverage is the key in an LBO that allows financial sponsors to purchase companies the size of News Corporation while only deploying a portion of the dry powder they have on hand, hence the name “Leveraged Buyout”. Along with the IRR for the rollover and sponsor, we see the IRR for the senior debt tranches. Below the summary is the sensitivity analysis with a data table showing the effect of various offer prices based on the hurdle rate, or minimum return, set by the private equity investor. The hurdle rate is important for investors to understand at what point do they decide to pursue an investment or not. For most private equity investments, an EV/LTM multiple above 6x is the typical threshold, as seen on the bottom of the table.

While this analysis is a completely fictional scenario, an LBO for News Corporation would be one of the biggest buyouts of all-time. It is also a deal that would be under immense political scrutiny as there is already plenty of controversy surrounding News Corporation and the idea that a small handful of corporations and families run about 90% of the news we receive on the daily. Although News Corporation no longer remains as the single giant entity it was before the asset split and eventual 21st century Fox acquisition by Disney, it is still a powerhouse as far as publishing and influencing the news. Succession gives a fascinating insider perspective to the internal politics, rifts, and drive for power that are typical in a family-owned conglomerate.

I hope you enjoyed reading, and please feel free to comment or message me any thoughts on the article or suggestions for future posts. I’ve attached the 10-K and 10-Q used for the LBO model as well as a download for the model itself so that you can take a deeper look at the numbers or use as a guide (turn on iterative calculations in your excel options/settings to avoid circularities).

References


https://www.sec.gov/Archives/edgar/data/1308161/000119312512460872/d428262d10q.htm#toc

https://www.sec.gov/Archives/edgar/data/1308161/000119312512355856/d389171d10k.htm#toc389171_12


Xerox-HP Merger Model and Analysis


In what has been a hotly contested and controversial move, Xerox has been making moves to acquire HP. This potential deal is fascinating for a few reasons. The first being that Xerox is a much smaller company than HP with a market cap of $6.4 billion compared to HP’s $62 billion value. That would imply a high debt load on the newly merged company which makes it attractive for financial sponsors to participate, especially considering the steady cash flows of both businesses. Another reason why a deal between the two companies would make sense is because they are both leaders in the printer market. They differ in that HP focuses on smaller printers for the average household/office while Xerox specializes in enterprise printers. By combining the two, the new company is able to cut costs on labor, services, and parts with potential synergies of $1.5 billion. This deal is being pushed heavily by famed investor, Carl Icahn – who owns 11% of Xerox and 4.4% of HP. He sees great value in owning the combined entity. Deal talks have not been friendly however as Xerox is using aggressive takeover tactics by attempting to shake up HP’s board, leading HP to implement a poison pill.

The best way to analyze the deal and its intricacies is through a merger model (which I have built and attached at the bottom of this post). The excel file also includes a 3-statement model with DCF analysis on both companies to understand what the implied value of the deal might look like. This is important to analyze because one of HP’s claims against Xerox’s acquisition attempt is that it undervalues the target company.

I began by modeling the deal structure. Xerox’s latest bid values HP at $24 per share, a 72% premium from the last closing price as of March 20, 2020. This values the deal at $31.126 billion. With a deal comprised of 20% stock and 80% cash, Xerox would have to issue 378 million shares in the transaction. Although the deal is 80% cash, only 10% of it would be financed through Xerox’s current cash holdings; the remainder would be financed with debt. In the Credit Statistics table below, we visualize how a highly leveraged deal would affect the newly combined company’s capital structure.

The pro forma net debt for the company comes out to almost $27 billion. A debt heavy structure is risky, but given the current low interest rate environment and the businesses’ steady cash flow generation, it is feasible. The deal would also create roughly $38 billion in goodwill for the combined company.

When it comes to analyzing any M&A deal, it is important to note whether the transaction is accretive or dilutive.

With the current deal structure assumptions and the state of both companies, the transaction is accretive by $2.32 per share. Typically, a strategic acquisition like this one results in an accretive deal because of the synergies that come along with the consolidation of the two businesses. The following years are also accretive by $1.60 and $2.44 respectively, showing that the deal is a good move in the long run.

The sensitivity table above shows how changes in the offer price and deal structure change the accretion/(dilution) per share. The results display how important a highly leveraged deal is to making the transaction accretive. As the percent of stock financing goes up, the deal becomes more dilutive. Xerox also has room to possibly meet HP’s demands for a higher offer price while keeping the deal accretive with a 20% stock structure.

The charts above display the results from the contribution analysis portion of the model. The first chart on the left helps visualize how much each company contributes to the combined company’s pro forma enterprise value, net income, EBITDA, and revenue. HP, the much larger company, contributes to over 80% of the enterprise value, EBITDA, and revenue; 68.6% when it comes to net income. The bottom chart compares HP’s implied share price based on revenue, EBITDA, and net income contribution to the current offer price of $24. This signifies that the Xerox’s valuation is not that far off, and that Xerox would not have to go much higher to appease HP’s demands; possibly $2 to $4 higher.

Consolidation between these two companies creates a giant in the printing industry, covering both desktop and office printers. HP has said that despite the persistence from Xerox, they are open to talking through a deal. That may mean that if a deal happens, it may be HP buying Xerox, creating a combined company with much less debt, but with same synergies. Advances in 3D printing could come much quicker as a result, and their services will be much more efficient. There will probably be a delay before anything is finalized given the COVID-19 crisis, but the potential for a deal is still there to be realized.

Thank you for reading! I recommend taking a look at the complete excel model attached below. Feel free to comment or message me what you think about a potential merger, as well as any thoughts on the M&A landscape given the disruption stemming from COVID-19.

References


https://fortune.com/2020/03/16/xerox-hp-takeover/


Discounted Cash Flow Analysis on Apple


Apple is a company that everyone is familiar with in the world of investing and in everyday life. Not many companies have performed as well in the public markets as Apple, having gone up 56.23% year-to-date upon writing this post. Despite its stellar performance, the impact of the coronavirus has had an adverse effect on the company. At the start of the new year, Apple had “slashed its quarterly revenue forecast for the first time in more than 15 years” citing a slowdown in Chinese sales, “which represents nearly 20% of Apple’s sales” (WSJ.com). The situation for Apple became worse after the coronavirus exacerbated investors’ fear in the markets while also taking a hit on the company’s production and sales.

I built a full 3-statement discounted cash flow model to dissect the financial situation that Apple faces in the current macroeconomic climate and to analyze where the company’s value currently lies in the midst of an uncertain situation. The complete model I built includes a 5-year forecasted financial statement model with accompanying schedules, and the discounted cash flow model. I’ve included a download for the excel sheet to see the full extent of the model as well as to use as a guide for anyone new to financial modeling.

To get an idea of how the coronavirus along with slowing demand for the iPhone might impact Apple’s earnings, I used a revenue growth assumption for the first year of 1.3% and 5% thereafter assuming production and sales resumes as per usual after the coronavirus threat subsides. This model is dynamic however, and includes the functionality to test different scenarios. In this model I built out a best, base, and weak case for the forecasted growth rates and margins, which can be toggled through on the top of the financial statements page of the excel file.

Free cash flow build up

Forecasting out the 3 financial statements is necessary for the free cash flow build up that drives the dcf model. Referencing the image above, make note of the EBITDA which peaks in 2022 at $102,331, but does not fall below the 3 historical year results. Although not recognized under US GAAP, EBITDA (which stands for Earnings Before Interest, Tax, and Depreciation & Amortization) is a useful metric in company valuation. It gives investors a look at a particular company’s operational performance and efficiency. By removing the costs of interest, taxes, and D&A, EBITDA allows you to compare the operational earnings for similar companies that may have different tax, debt, and capital structures. From EBITDA we can ultimately arrive at the Unlevered Free Cash Flow, which is then discounted to find the present value.

Enterprise Value using both the Perpetuity and the Exit EBITDA Multiple approaches

We arrive at Apple’s enterprise value, which is essentially the market cap including any cash and debt the company holds on its balance sheet. There are two approaches to calculating the enterprise value; Perpetuity approach and Exit EBITDA Multiple approach. Although both are used in this model for comparison, the Exit EBIDTA Multiple approach is the better method because the Perpetuity approach assumes that the company will grow at the same rate forever, typically resulting in the terminal value being higher than in the alternate approach. Assuming a 12x EBITDA multiple (derived and adjusted from the industry average), Apple’s enterprise value stands at $1,156,766.

Fair Value and WAAC build up

From the enterprise value we can calculate the equity value by subtracting net debt and any trapped cash. The equity value represents Apple’s value available through its shareholders. On a per share basis, we can see what the fair value market price of Apple should be. As of 02/28/2020’s close ($273.36), the equity value per share using the Perpetuity and Exit EBITDA Multiple approaches tell us that the company’s shares are trading at a 23.8% and 4% discount respectively. This means that based on my model, Apple is currently trading below its fair value. Once the extent and ramifications of the coronavirus become clearer, it can be a great opportunity to build a position in Apple. Following the equity value calculation is the WACC breakdown, which gives us a 7% cost of capital. Apple is a unique example because they hold negative debt, which is why the market value of equity accounts for 109.5% of the total capital structure.

Equity Value per Share sensitivity tables

The dcf calculation is now complete following the WACC, but there are some added tables and charts that can paint a better picture of Apple’s numbers. In the image above, I built sensitivity tables to show how equity value per share in affected by changes in the long-term growth rate, EBITDA multiple, and WACC. The numbers in red highlight those conditions in which the equity value per share is below the last closing price. Sensitivity tables are especially important in investment banking because they will typically show up in the pitch books.

Football Field graph and Last Twelve Months’ EV/EBITDA calculation

A football field graph can give you an idea of the dcf value at different growth rates/multiples compared to the 52 week high/low market price. As expected, the perpetuity approach produces a much larger range that far surpasses the 52 week numbers while the exit EBITDA is on the mid-upper end of the 52 week price. To the right is the last twelve months’ EBITDA multiple calculation. This is useful for comparing to the exit multiple used throughout the model. As we can see, the 12x multiple assumed in the model is not too far off the LTM 13.2x multiple.

Financial modeling is one of the most useful skills in any finance professional’s tool kit. Beyond the modeling itself, it is also a useful exercise in picking apart and analyzing a company’s financial statements. Valuation is about understanding a business and its drivers to determine how much a company can be worth. Going forward, I plan on building out more models and focusing on developing an investment thesis.

References


https://www.wsj.com/articles/apple-revises-guidance-sees-lower-revenue-in-fiscal-1st-quarter-11546465050


Design a site like this with WordPress.com
Get started